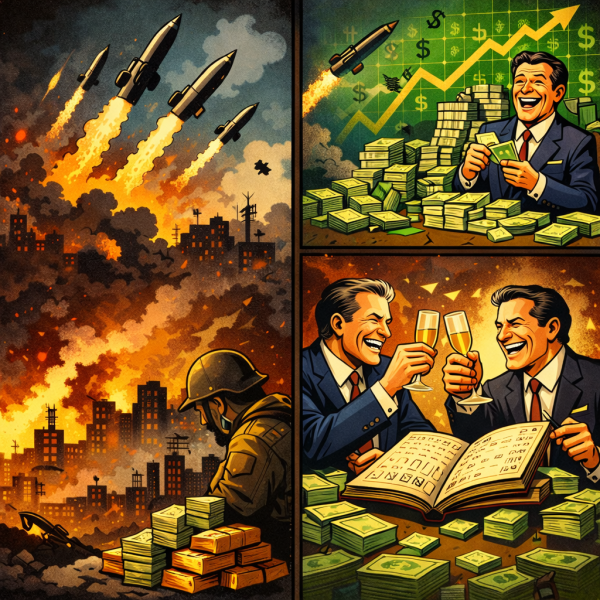
Real-Time Analytics in Microsoft Fabric

In today’s data-driven world, many business scenarios demand insights not in hours or days, but in seconds. From monitoring IoT devices to tracking live transactions, real-time analytics enables organizations to act immediately. Microsoft Fabric delivers this capability through KQL databases and event streams, making it easier to ingest, query, and analyze fast-moving data at scale.

Transforming Data with Dataflows Gen2 in Microsoft Fabric

In Microsoft Fabric, raw data from multiple sources flows into the OneLake environment. But raw data isn’t always ready for analytics. It needs to be cleaned, reshaped, and enriched before it powers business intelligence, AI, or advanced analytics. That’s where Dataflows Gen2 come in. They let you prepare and transform data at scale inside Fabric, without needing heavy coding, while still integrating tightly with other Fabric workloads.

Setting Up Your First Microsoft Fabric Workspace

If you’re starting with Microsoft Fabric, the first thing you’ll need is a workspace, it is a central hub where all data-related assets live. Think of it as your project’s headquarters: datasets, pipelines, Lakehouses, dashboards, and governance settings are all managed here.

Top Azure Services You Should Master in 2025

Microsoft Azure remains a powerhouse in the cloud ecosystem, driving innovation across AI, automation, and data analytics. As industries increasingly rely on cloud-native solutions, mastering the right Azure services in 2025 is essential for cloud professionals, developers, and architects who want to stay ahead of the curve.

Power BI DAX Hacks for Faster Reporting

If you’ve used Power BI for any amount of time, you know that DAX (Data Analysis Expressions) is both powerful and, at times, puzzling. While it unlocks deep analytical capabilities, it can also slow down your reports if not used wisely.

Storytelling with Data: Beyond the Graphs

In a world full of dashboards, reports, and visualizations, simply showing data is not enough. If you want your audience to understand, remember, and act on the insights, you need to go beyond the graph. You need to tell a story. Welcome to the world of storytelling with data, where raw numbers are transformed into compelling, clear, and meaningful narratives that spark decisions.

Secrets to Designing a High-Impact Dashboard

In today’s data-driven world, dashboards are everywhere; in executive meetings, marketing reviews, sales stand-ups, and operations war rooms. Yet despite their prevalence, most dashboards fail to deliver real value. They’re cluttered, confusing, or just ignored. A high-impact dashboard isn’t just a collection of charts. It’s a powerful decision-making tool. When designed well, it answers questions before they’re asked and guides teams to take confident, timely action.

Create a website or blog at WordPress.com

Up ↑