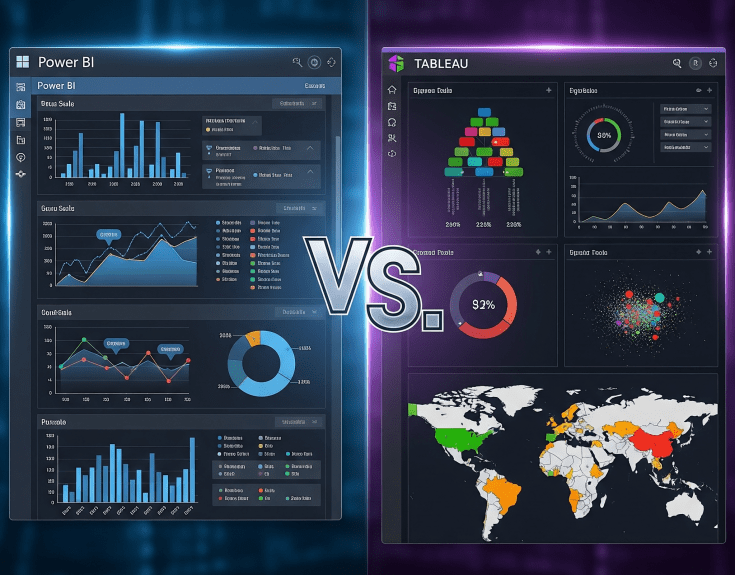
When it comes to data visualization and business intelligence (BI), Power BI and Tableau are two of the most popular platforms in the world. Both turn raw data into insights, but they differ in cost, ecosystem fit, and flexibility.
So, which one is best? Let’s break it down.
Power BI (Microsoft-Centric & Accessible)
- Cost Advantage: Power BI is one of the most affordable enterprise BI tools.
- Power BI Pro ($20/user/month) make it cost-effective at scale.
- Bundled with Microsoft 365 E5 licenses, reducing incremental cost for enterprises already using Office.
- Microsoft Office Ecosystem: Seamlessly integrates with Excel, Teams, Outlook, and Azure.
- Easy for business analysts already comfortable with Excel.
- Collaboration is native through Teams and SharePoint.
- Ease of Use: Familiar, Excel-like interface and low learning curve.
- Use Cases: Self-service BI, enterprise dashboards, ad hoc reporting, and governance at scale.
Best For: Microsoft-first organizations seeking an affordable, scalable, and tightly integrated BI solution.
Tableau (Design-Driven & Flexible)
- Cost Considerations: Tableau is generally more expensive.
- Tableau Creator ($42/user/month), Viewer (~$15/user/month).
- Higher TCO (total cost of ownership) for large deployments compared to Power BI.
- Visualization Power: Best-in-class for design flexibility and data storytelling.
- Ecosystem Agnostic: Works seamlessly across AWS, GCP, Azure, on-premise, and hybrid setups.
- Data Handling: Excellent with large, complex datasets and multiple sources.
- User Experience: Drag-and-drop simplicity for advanced users who need customization.
Best For: Enterprises that prioritize visual storytelling and flexibility across multiple ecosystems, and are less constrained by cost.
Key Takeaway
There isn’t a one-size-fits-all “winner.”
- Choose Power BI if cost efficiency, fast adoption, and deep Microsoft Office integration are priorities.
- Choose Tableau if advanced visualization, ecosystem flexibility, and data storytelling are your main drivers.
Many organizations adopt a hybrid approach, using Power BI for enterprise reporting and governance, while leveraging Tableau for advanced visualizations and data science teams.

Leave a comment